Animation Registry
Production-Grade Motion Engineered
Tailwind & React animations optimized for strategic dashboards, high-fidelity pitch decks, and enterprise GTM interfaces.
Browse
109 results · page 1 of 4
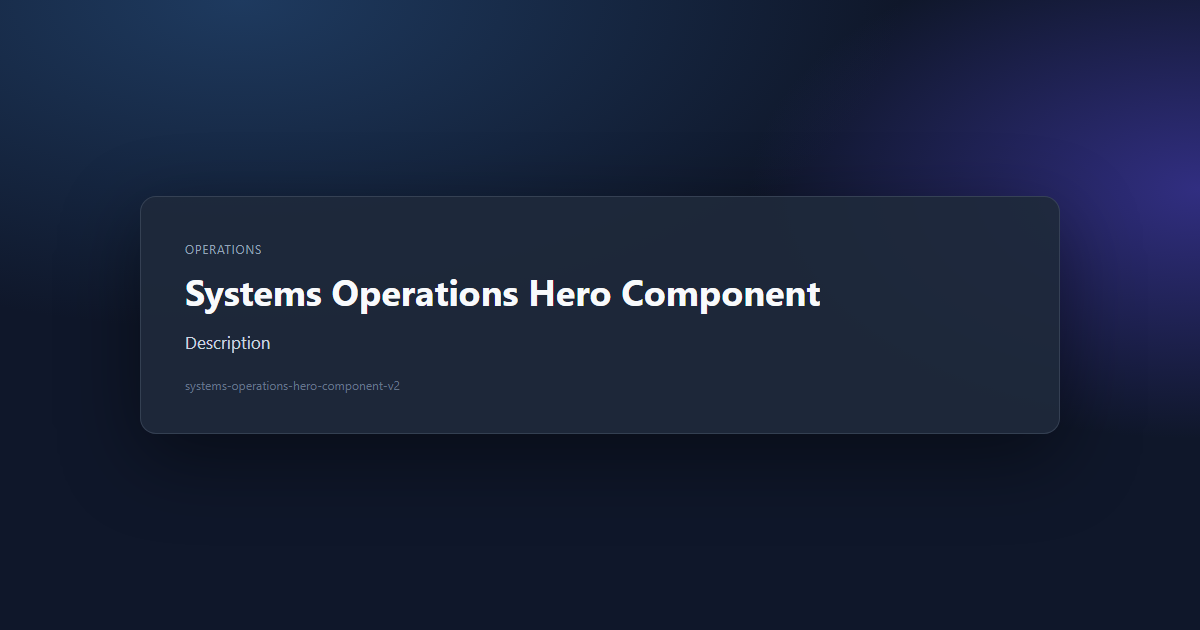
Systems Operations Hero Component
Systems operations hero component focused on core infrastructure KPIs, service status, and execution stability.
Preview →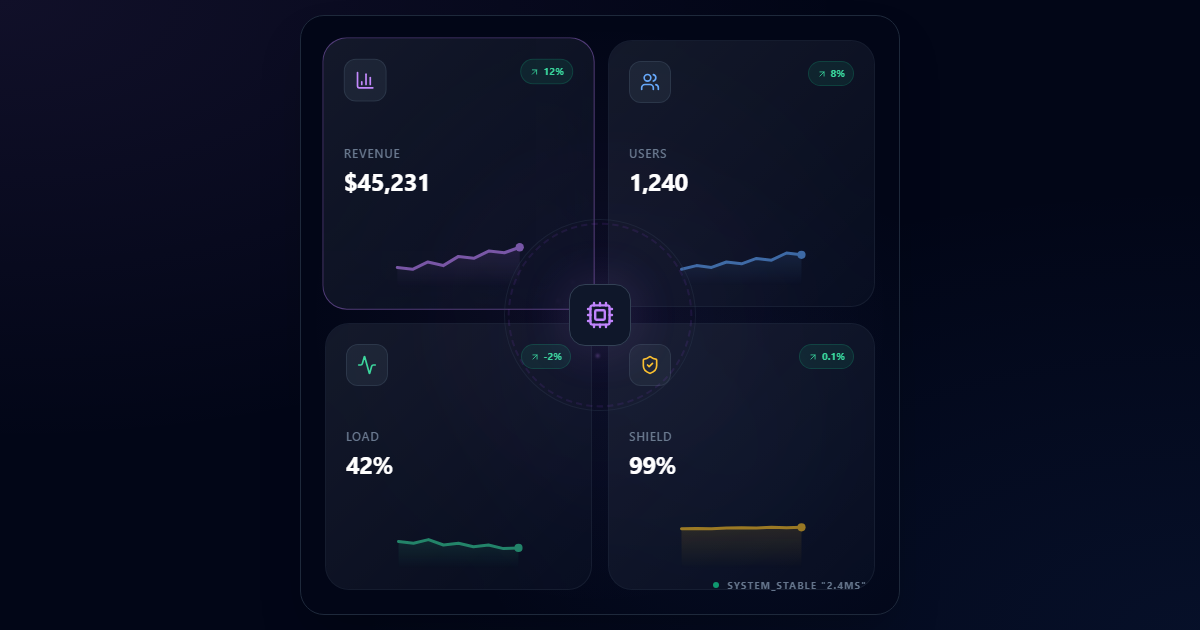
Revenue Systems Data Flow
Revenue systems dashboard tile mapping data flow, pipeline health, and operational performance indicators.
Preview →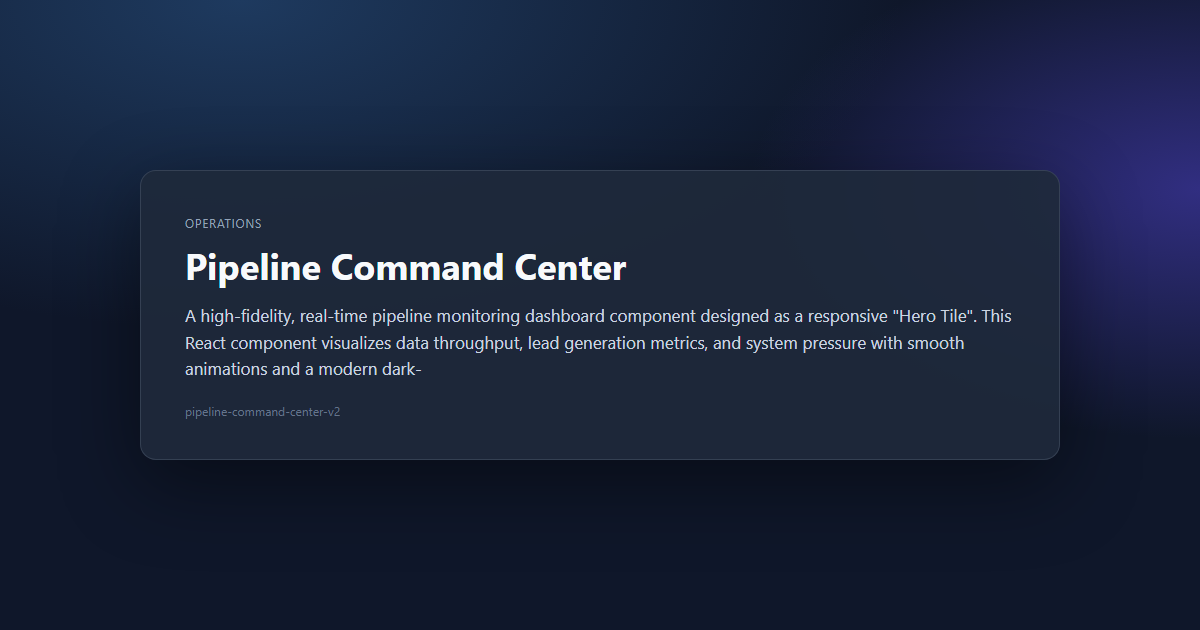
Pipeline Command Center
A high-fidelity, real-time pipeline monitoring dashboard component designed as a responsive "Hero Tile". This React component visualizes data throughput, lead generation metrics, and system pressure with smooth animations and a modern dark-
Preview →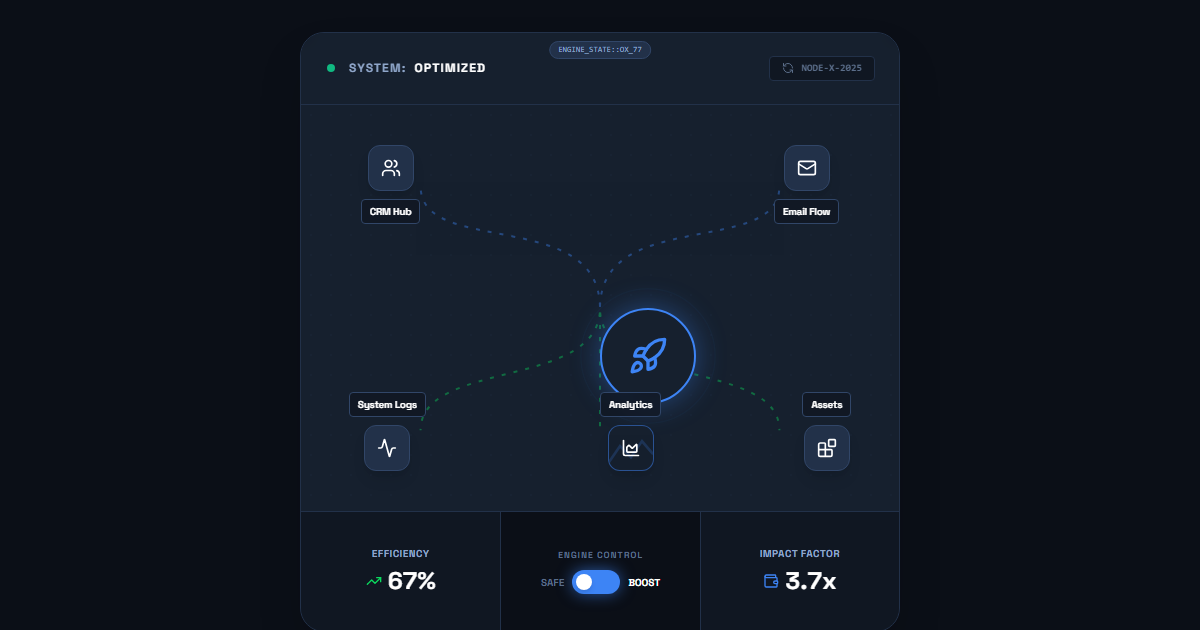
MarTech AI Dashboard Engine
Operations-focused MarTech AI dashboard engine that visualizes service health, orchestration flow, and optimization status.
Preview →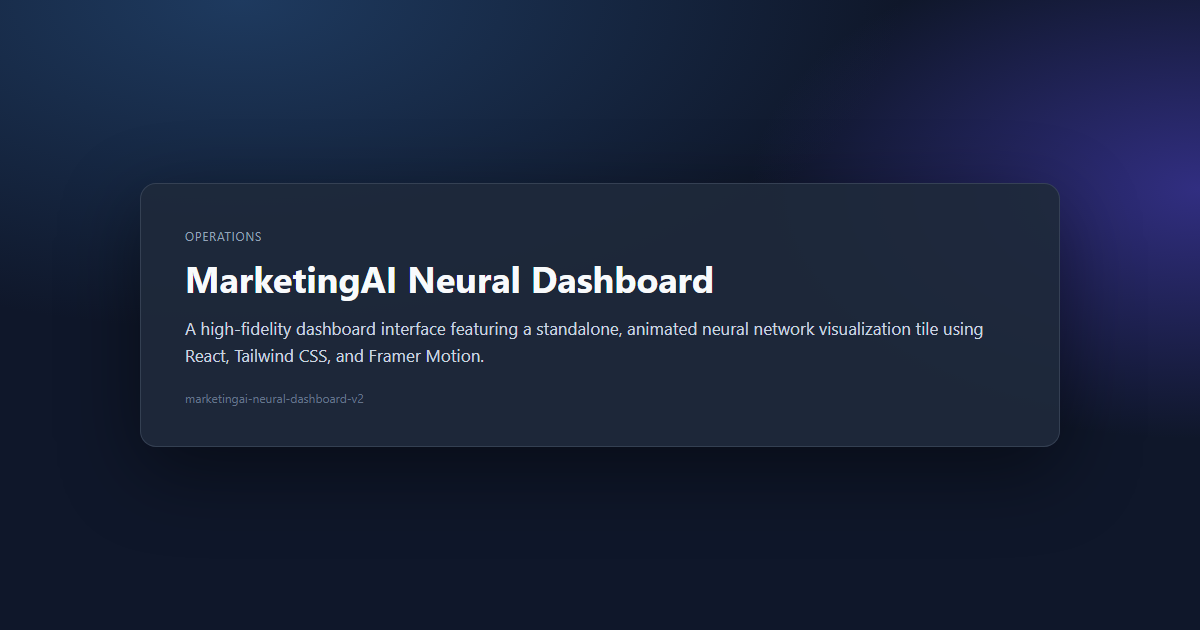
MarketingAI Neural Dashboard
A high-fidelity dashboard interface featuring a standalone, animated neural network visualization tile using React, Tailwind CSS, and Framer Motion.
Preview →
MarketingAI Intelligence Dashboard
MarketingAI Intelligence Dashboard
Preview →
Marketing Revenue Analytics
A high-fidelity revenue analytics dashboard component highlighting pipeline health, attribution, and performance trends.
Preview →
Marketing Operations Workflow Tile
Marketing operations tile visualizing process handoffs, system alignment, and throughput performance across workflow stages.
Preview →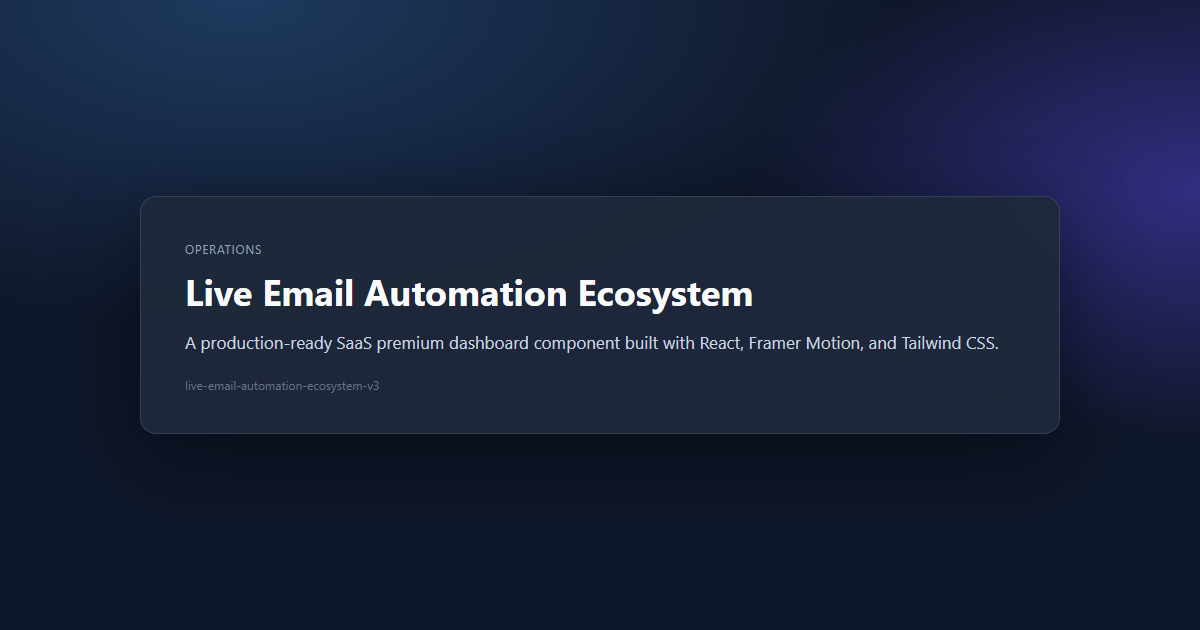
Live Email Automation Ecosystem
Updated live email automation ecosystem tile focused on orchestration flow, channel timing, and engagement lift.
Preview →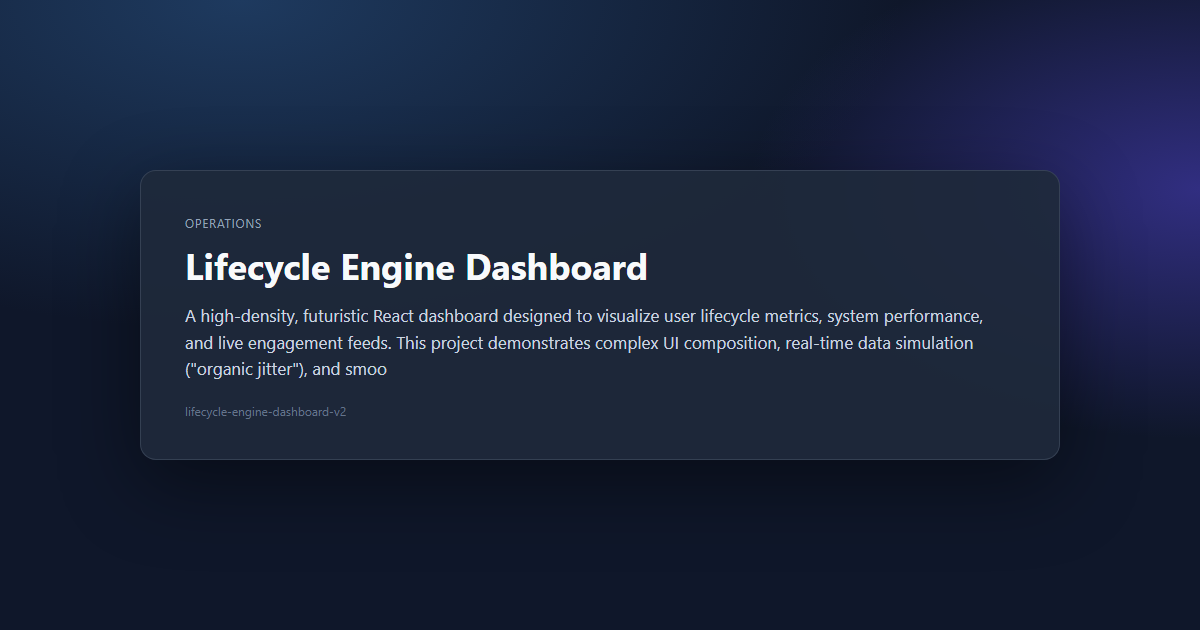
Lifecycle Engine Dashboard
A high-density, futuristic React dashboard designed to visualize user lifecycle metrics, system performance, and live engagement feeds. This project demonstrates complex UI composition, real-time data simulation ("organic jitter"), and smoo
Preview →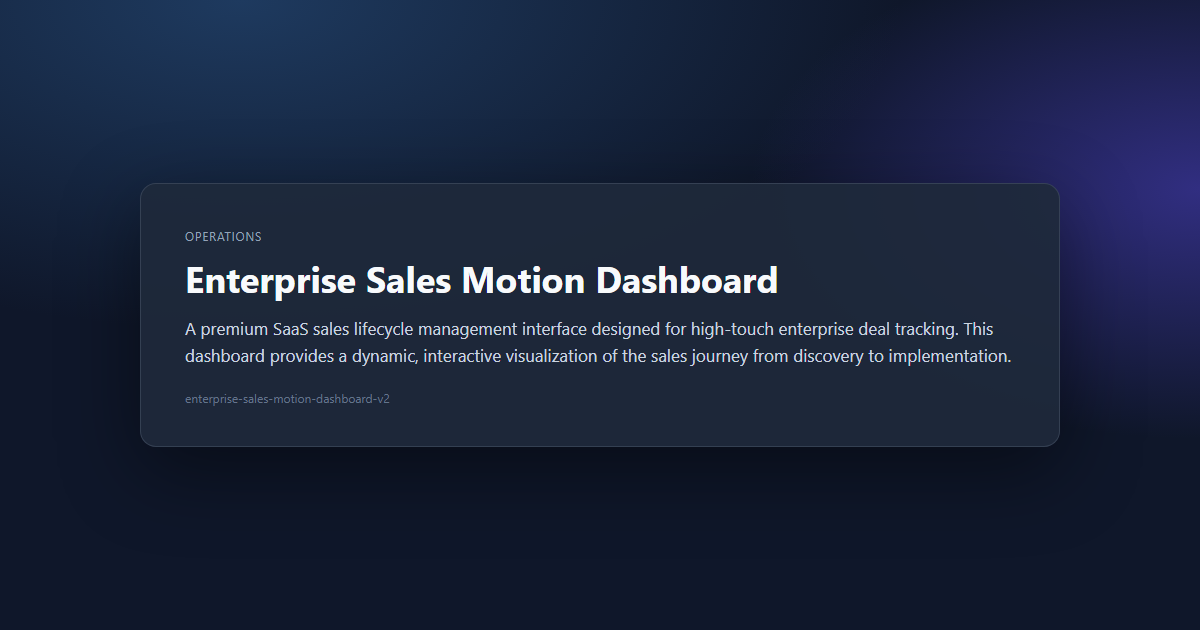
Enterprise Sales Motion Dashboard
A premium SaaS sales lifecycle management interface designed for high-touch enterprise deal tracking. This dashboard provides a dynamic, interactive visualization of the sales journey from discovery to implementation.
Preview →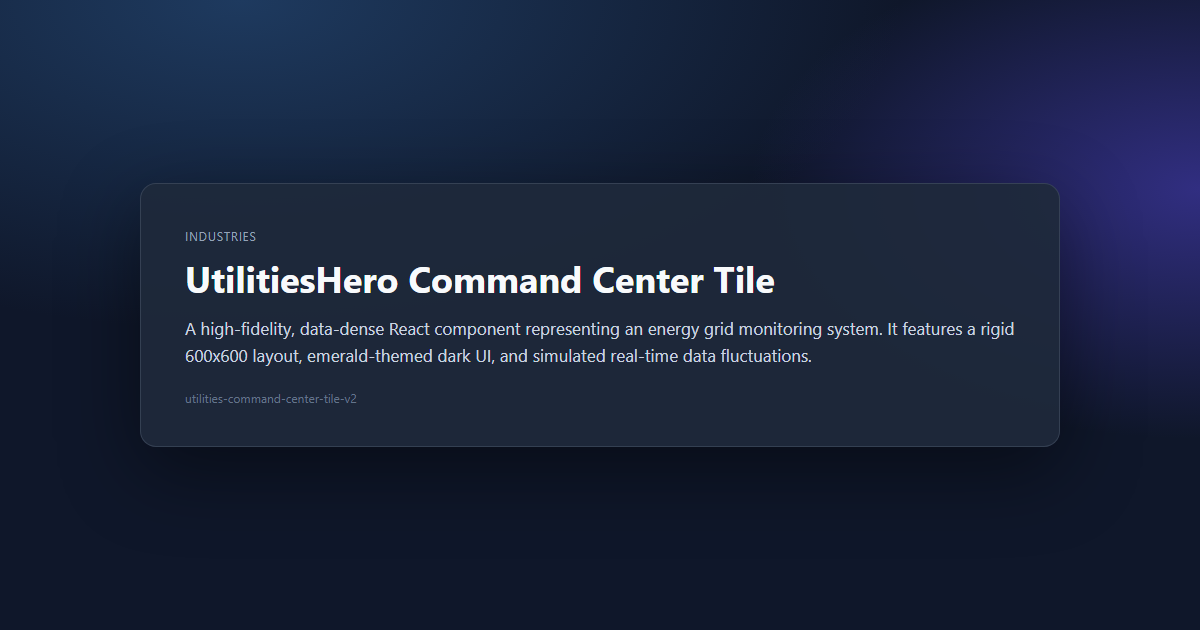
Utilities Command Center Tile
Utilities command center tile showing grid stability, operational load, and critical infrastructure health status.
Preview →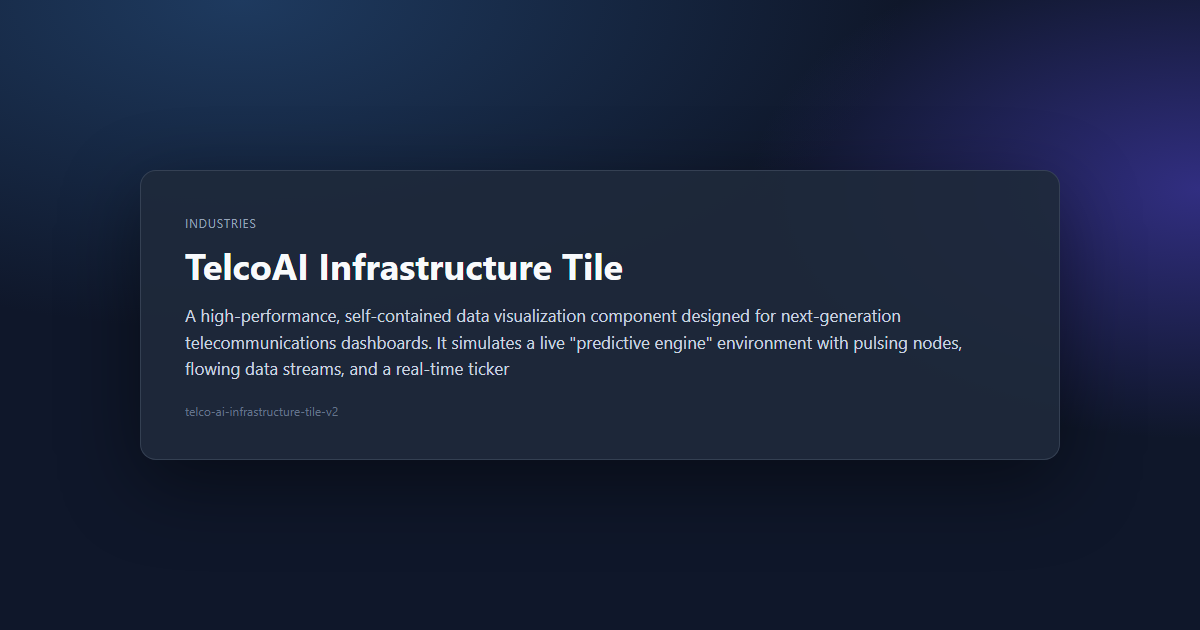
Telco AI Infrastructure Tile
Telecommunications AI infrastructure tile visualizing network intelligence, service load, and predictive operations signals.
Preview →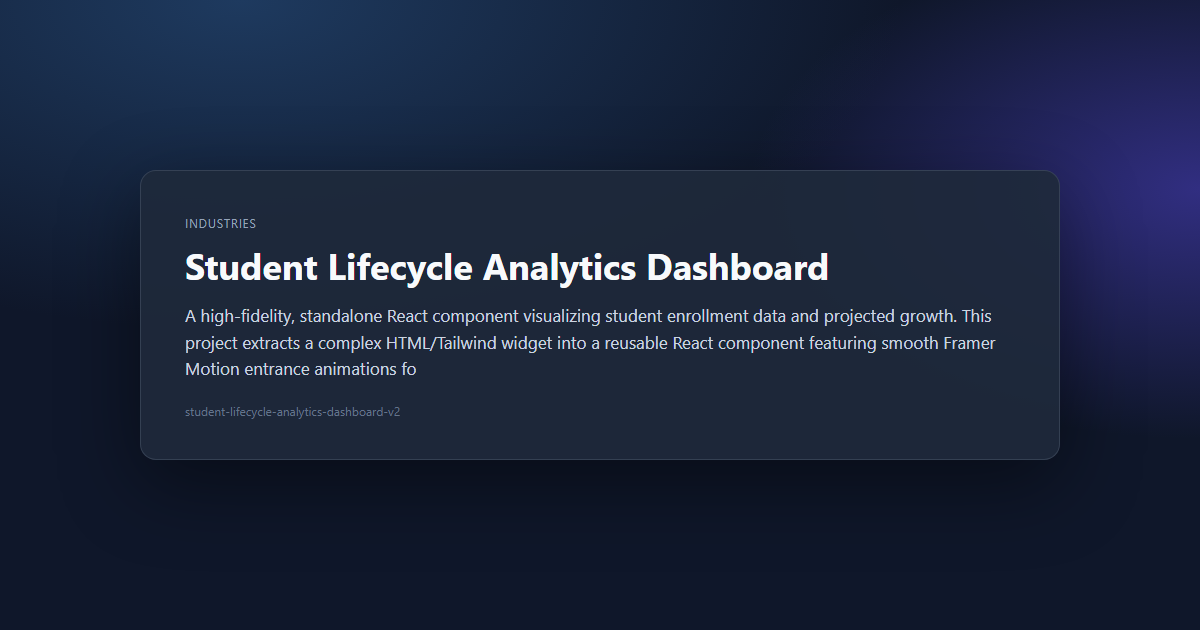
Student Lifecycle Analytics Dashboard
Student lifecycle dashboard visualizing application flow, enrollment progression, and retention-oriented growth metrics.
Preview →
Retail Pulse Analytics Tile
Retail analytics tile tracking traffic-to-conversion performance, engagement pulse, and revenue trend direction.
Preview →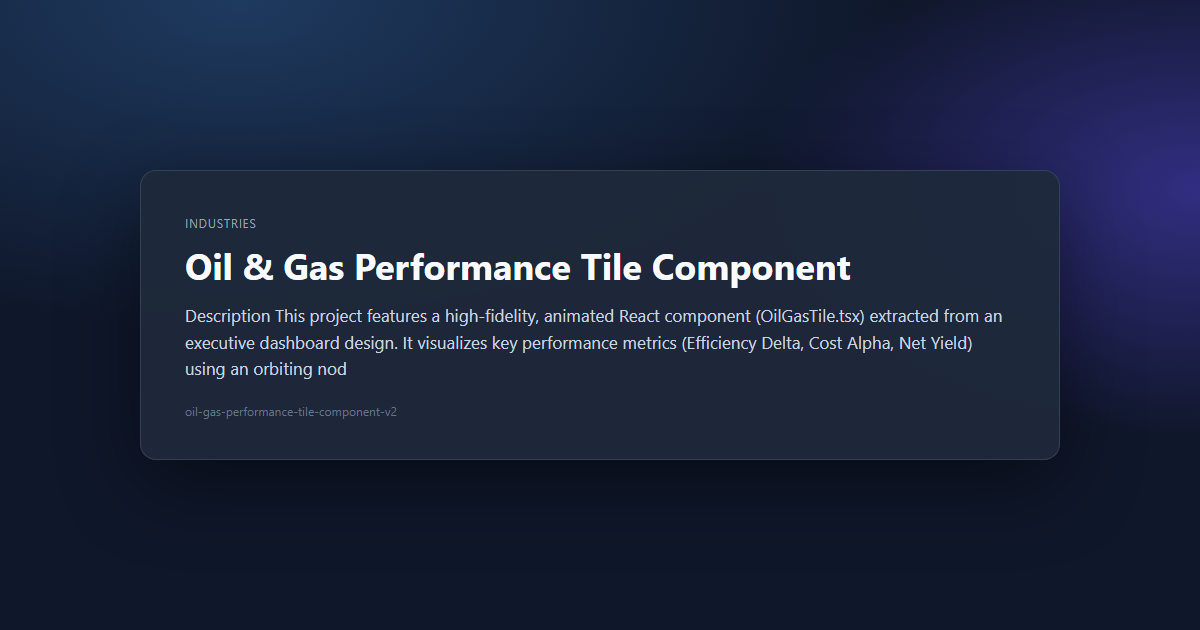
Oil & Gas Performance Tile Component
Oil and gas performance tile tracking operational efficiency, cost dynamics, and yield performance indicators.
Preview →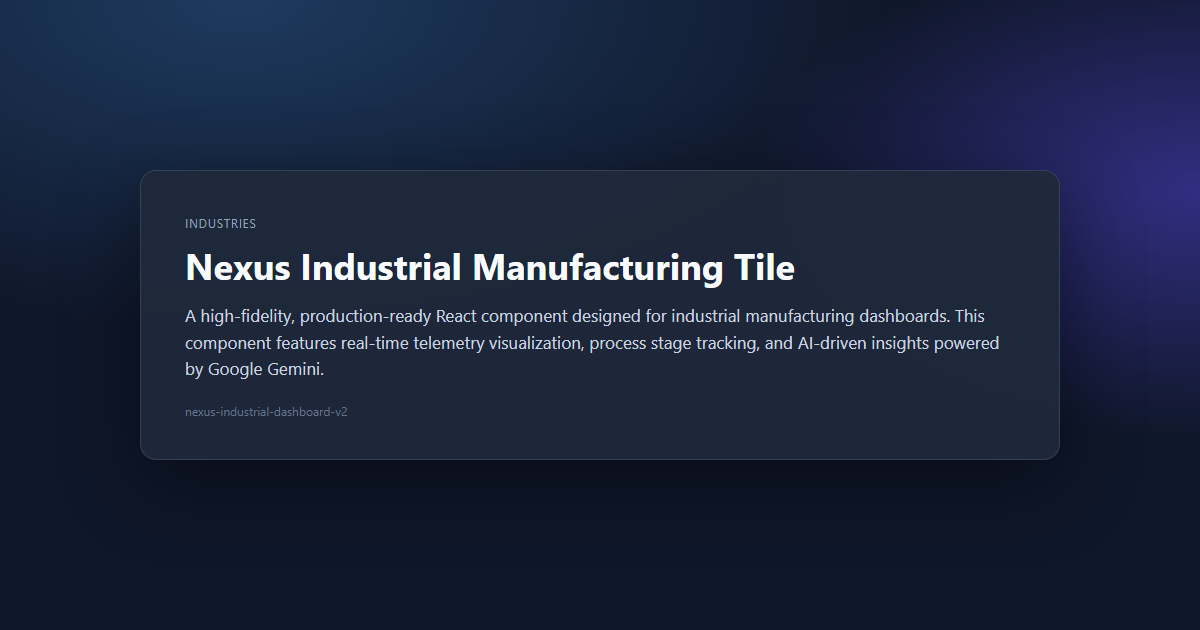
Nexus Industrial Dashboard
Industrial operations dashboard for monitoring telemetry flow, process stages, and production health indicators.
Preview →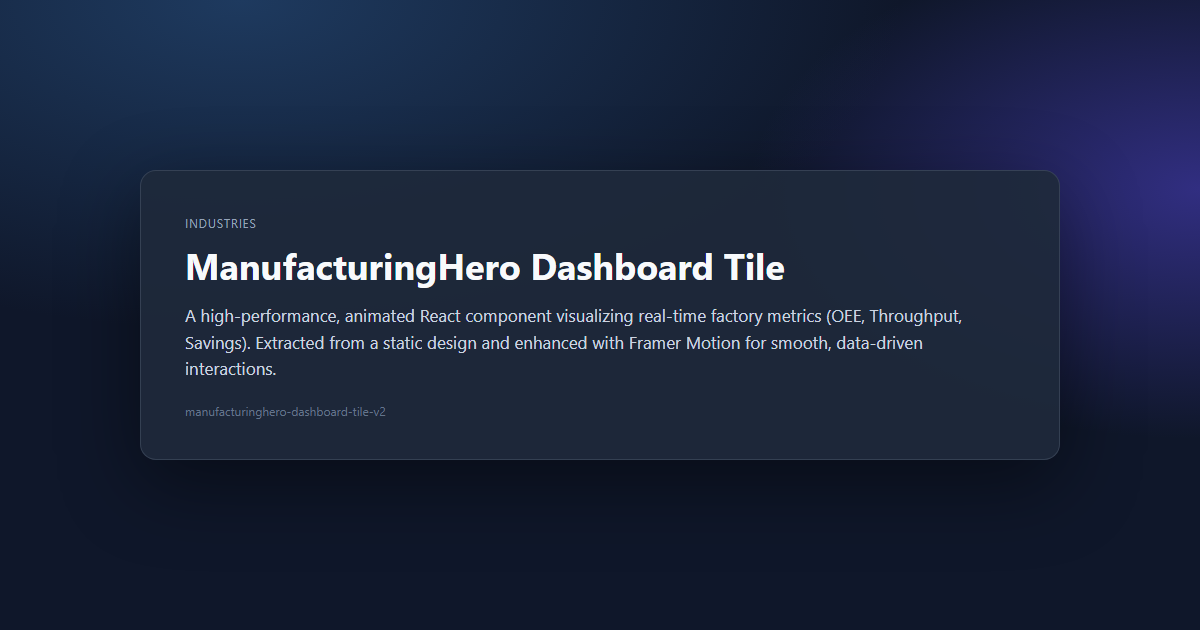
ManufacturingHero Dashboard Tile
Manufacturing dashboard tile focused on factory KPIs, throughput visibility, and performance trend movement.
Preview →
Manufacturing Hero Dashboard Tile
Manufacturing hero tile focused on operational KPIs, throughput trends, and performance stabilization signals.
Preview →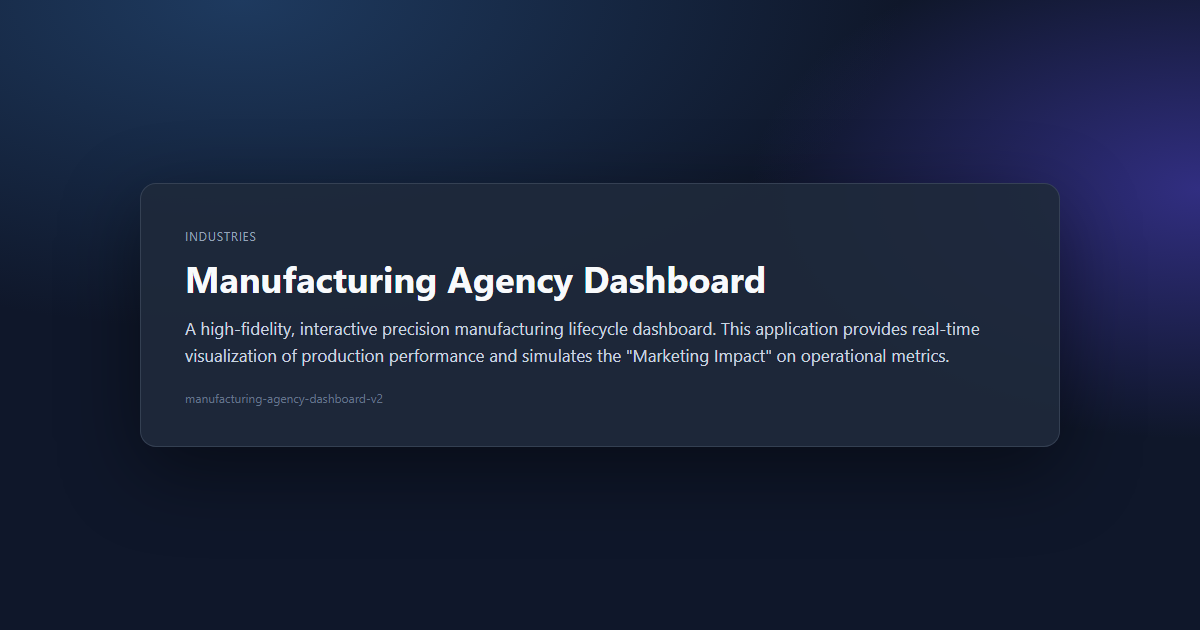
Manufacturing Agency Dashboard
Manufacturing dashboard tile for agency reporting on lifecycle efficiency, yield movement, and process impact.
Preview →
Industrial ROI Dashboard
A premium, production-ready ROI dashboard designed for industrial manufacturing environments. This application provides high-fidelity visualizations of key performance indicators (KPIs) with a focus on aesthetics, real-time feedback, and ex
Preview →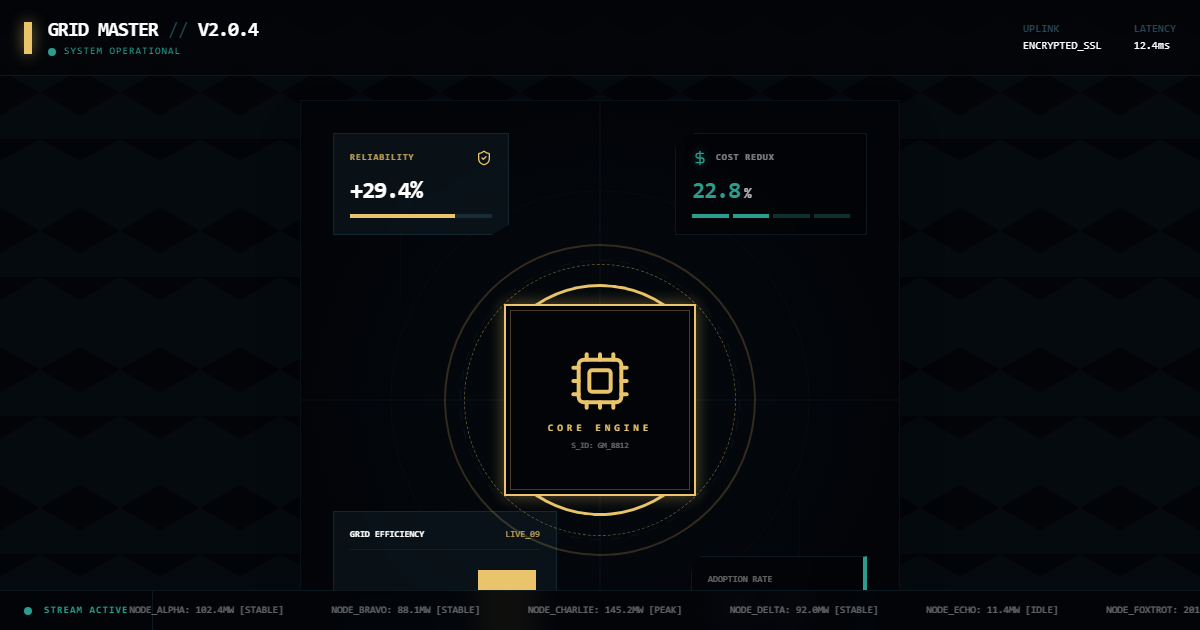
Grid Master Cyber Infrastructure Dashboard
Cyber infrastructure dashboard visualizing grid resilience, system telemetry, and operational risk signals in real time.
Preview →
FleetOptima Driver Performance Tile
Driver performance tile showing fleet-level behavior, weekly efficiency patterns, and operational performance status.
Preview →
Fleet ROI Calculator
Fleet ROI calculator tile that models savings impact, operational efficiency, and performance gains from scenario inputs.
Preview →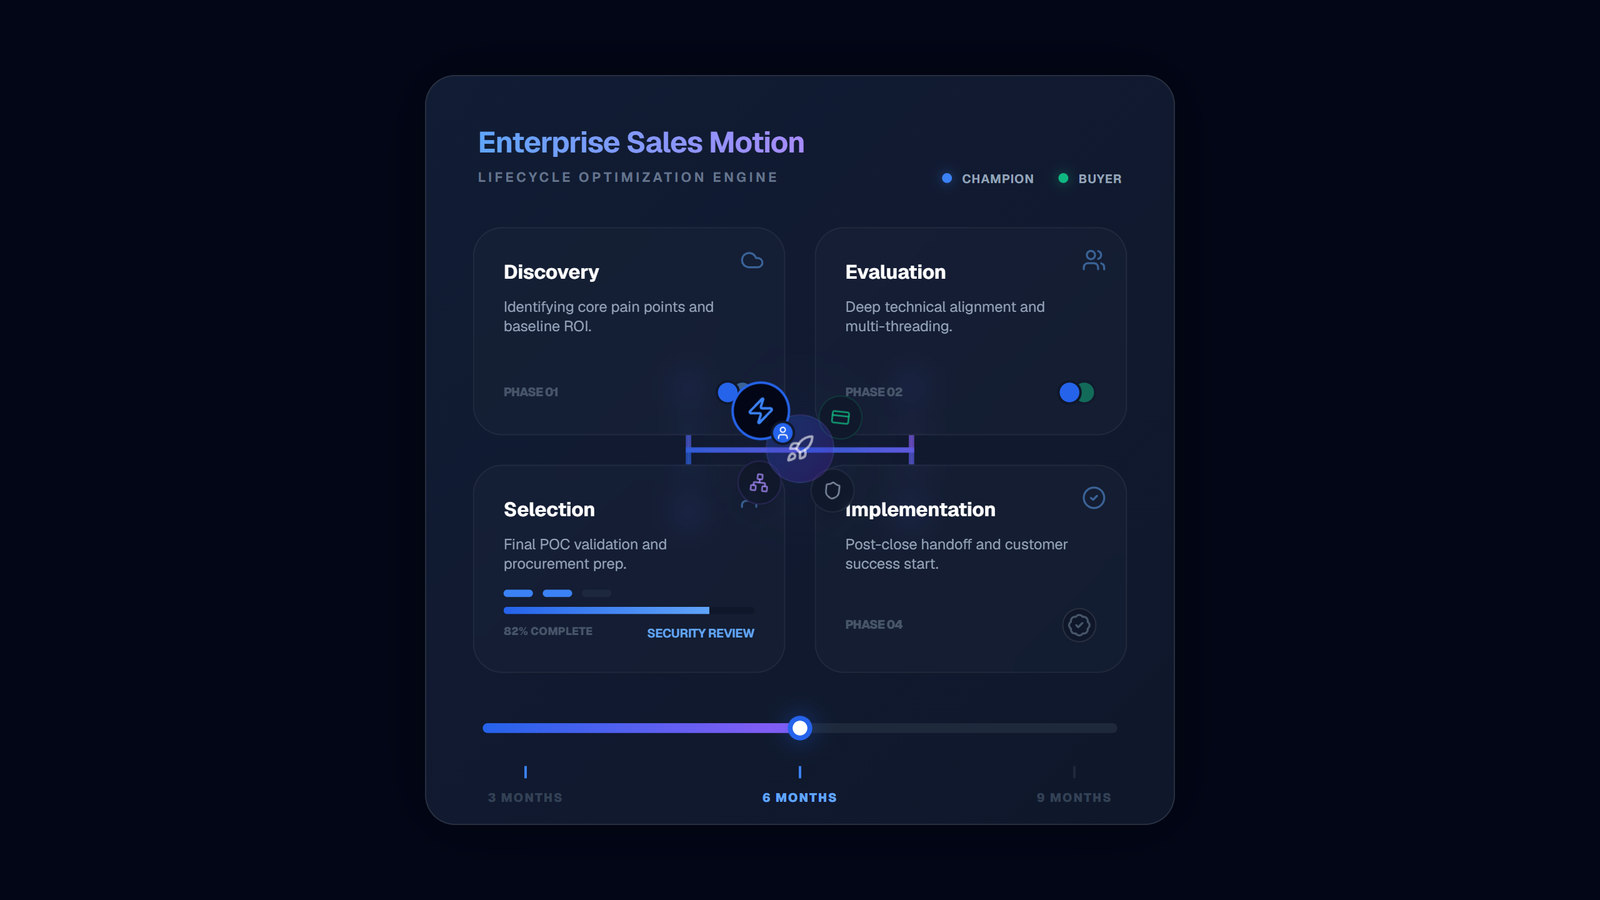
Enterprise Sales Motion Dashboard
Enterprise sales-motion dashboard visualizing stakeholder movement, cycle progression, and deal execution momentum.
Preview →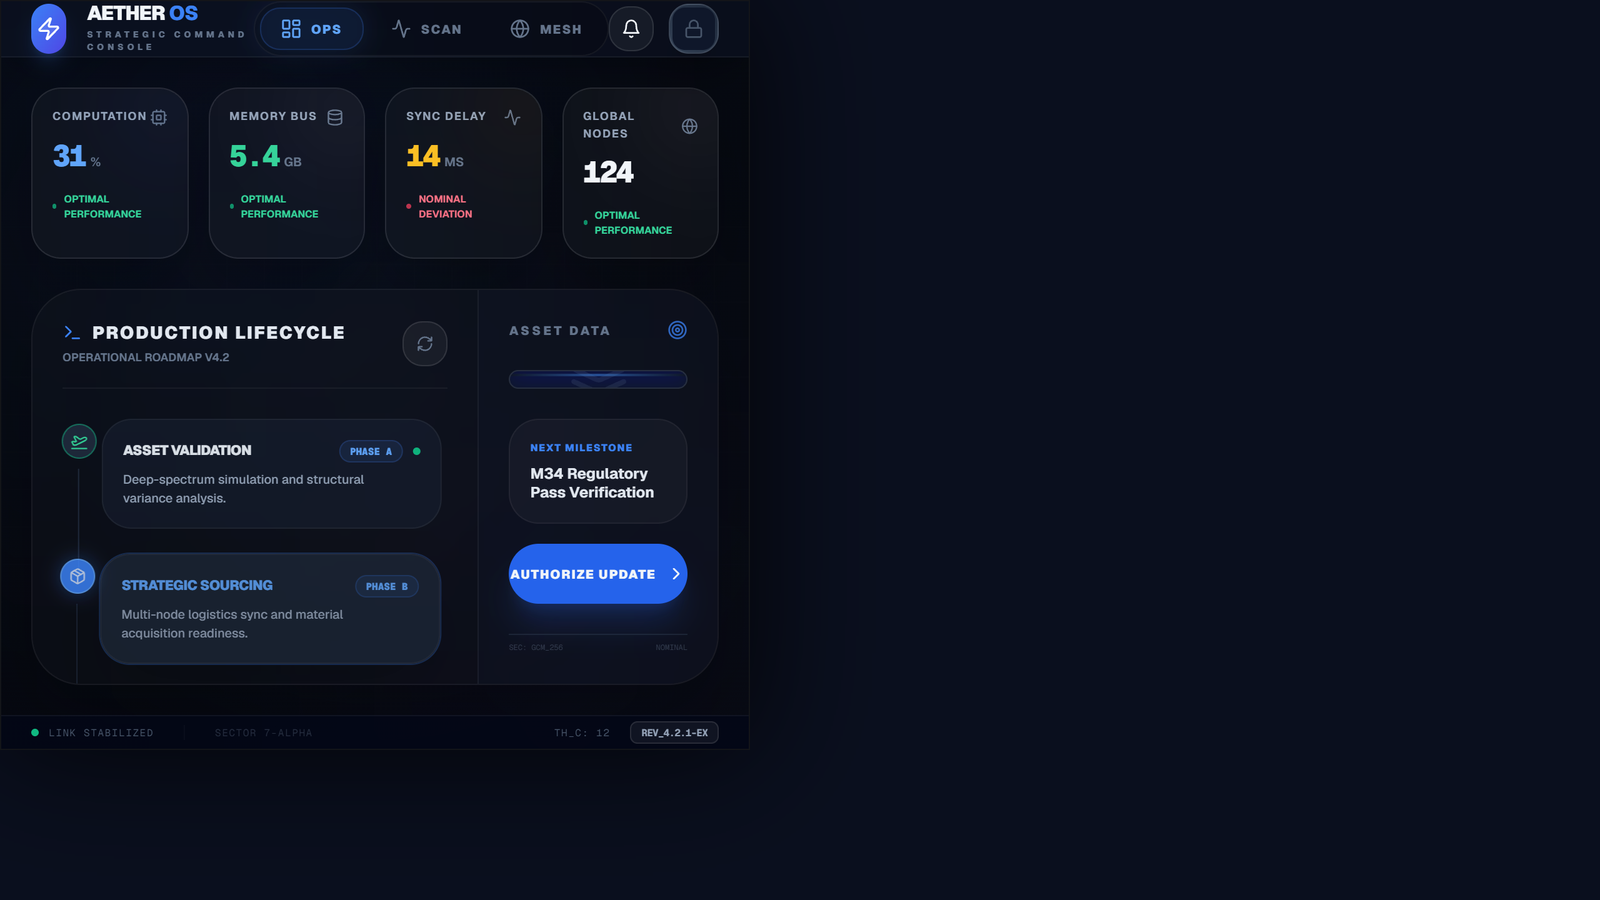
Engineering Excellence Workflow System
Engineering workflow system tile presenting lifecycle execution, system load, and delivery readiness in a compact view.
Preview →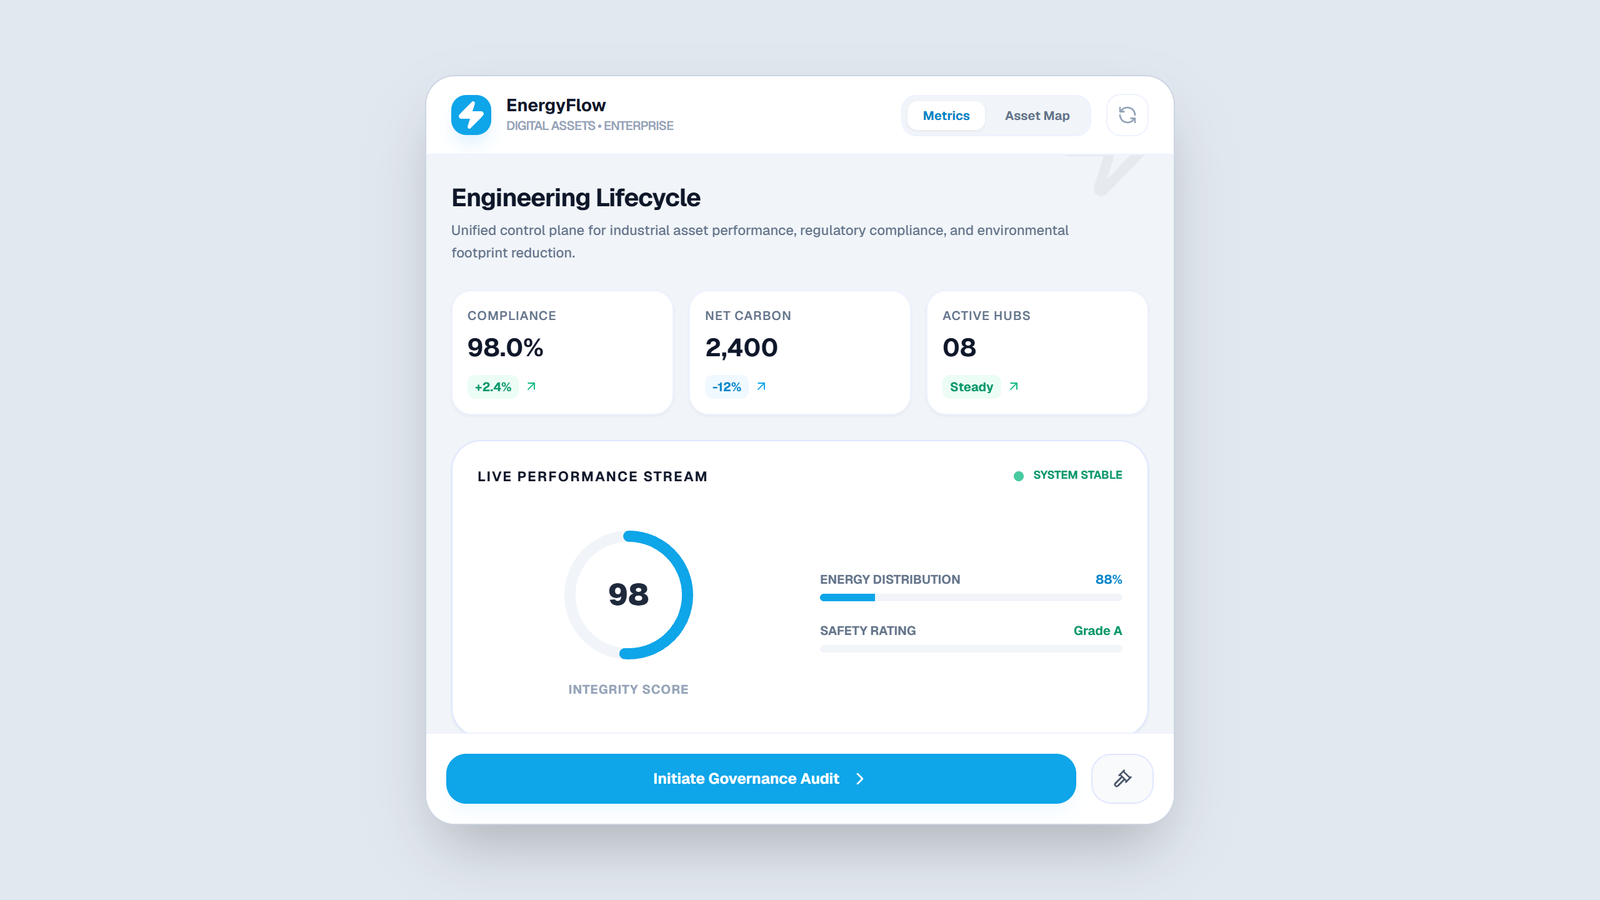
EnergyFlow Minimal Dashboard
Minimal energy operations dashboard visualizing asset health, workflow status, and efficiency performance signals.
Preview →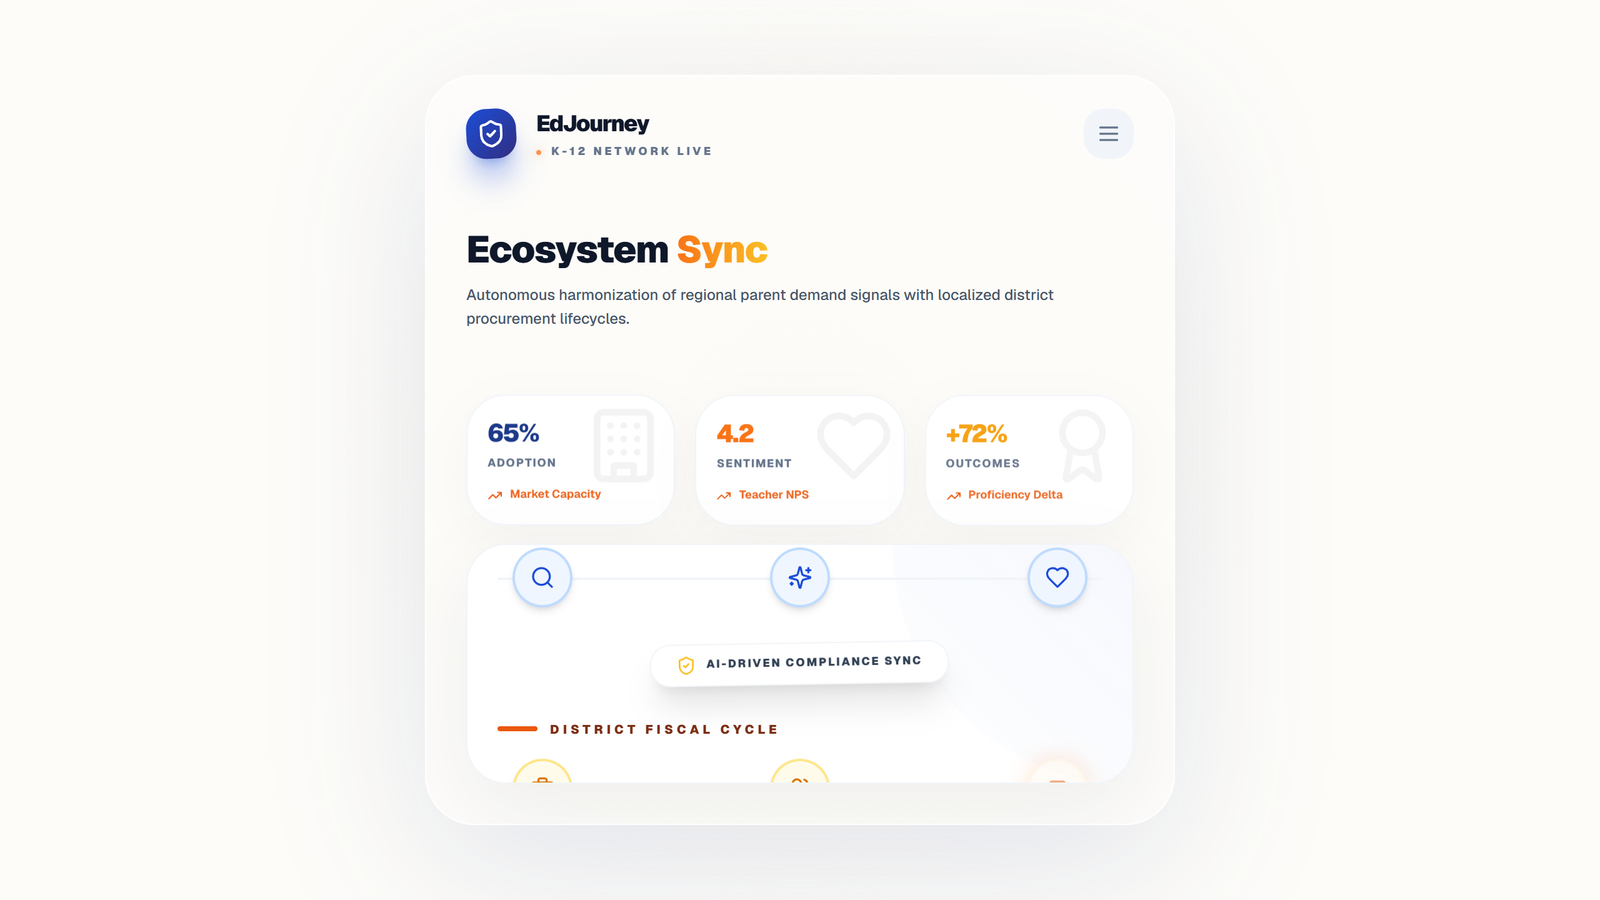
Education Journey K-12 Ecosystem
K-12 ecosystem dashboard mapping parent demand, district cycles, and education adoption readiness across stages.
Preview →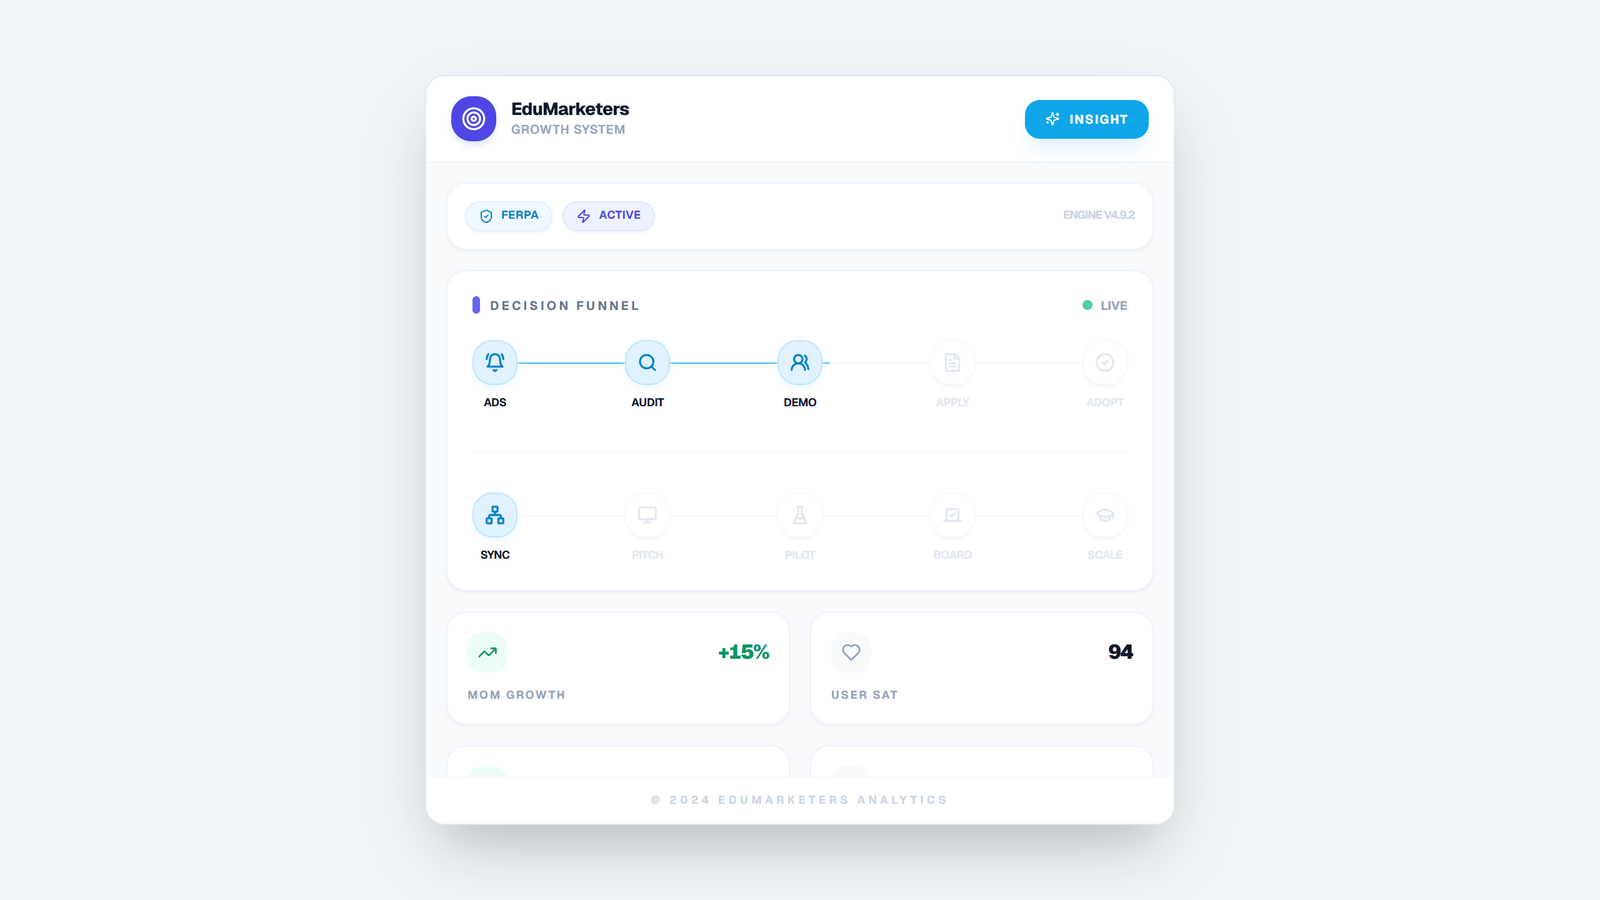
EduMarketers Dashboard
EdTech marketer dashboard presenting dual-path adoption signals, campaign efficiency, and stakeholder-ready growth metrics.
Preview →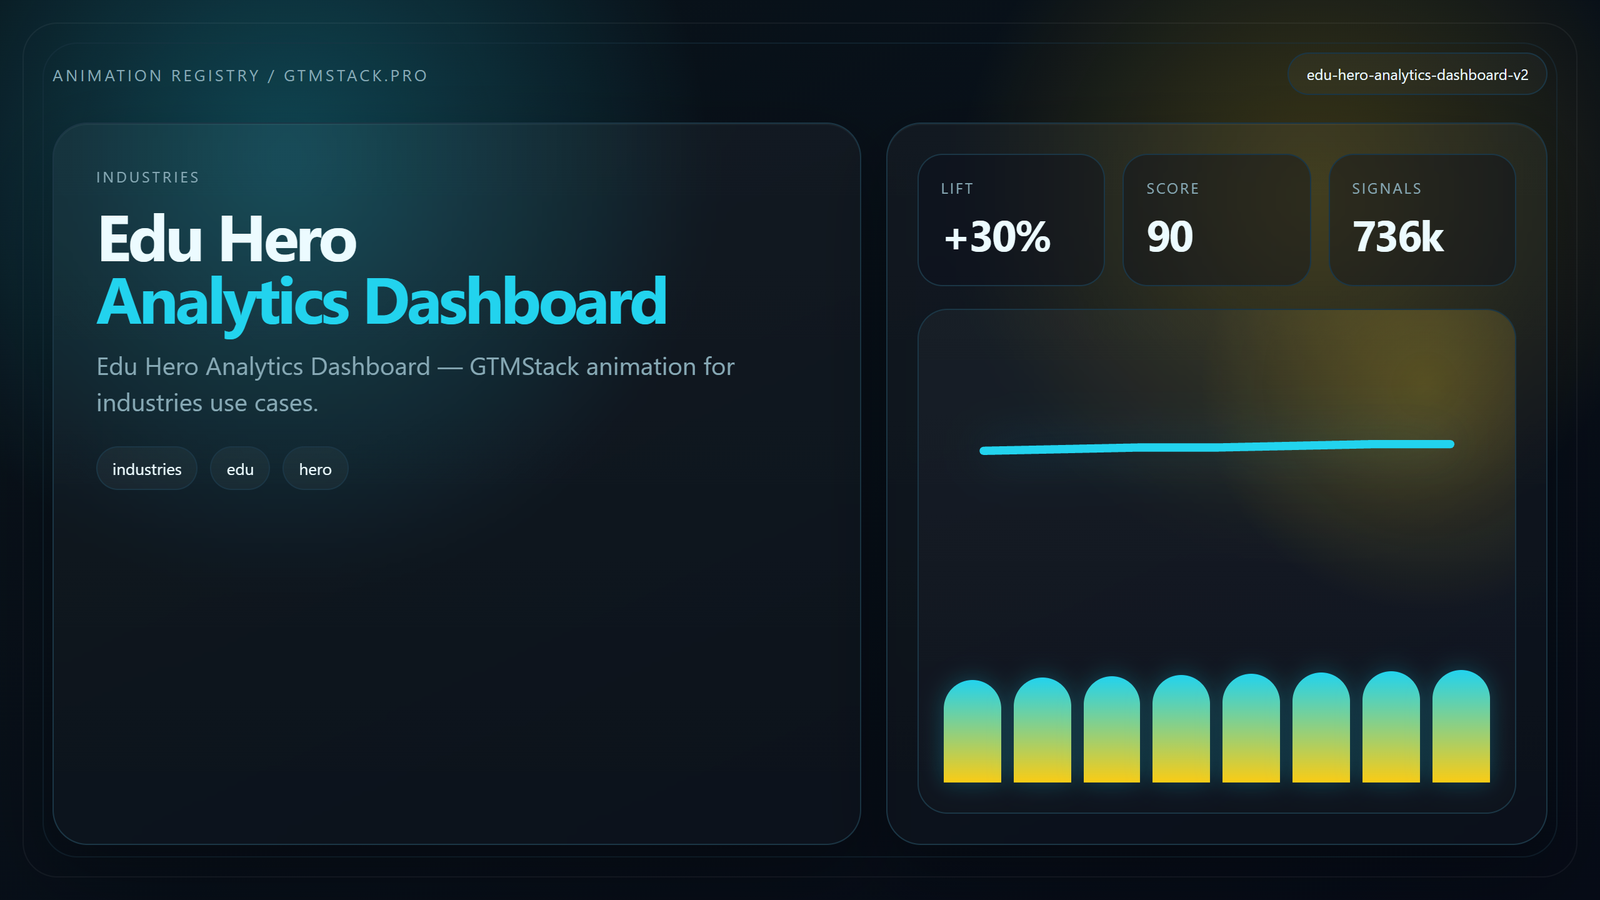
EduHero Analytics Dashboard
Education analytics dashboard tile showing learner funnel movement, campaign performance, and institutional growth trends.
Preview →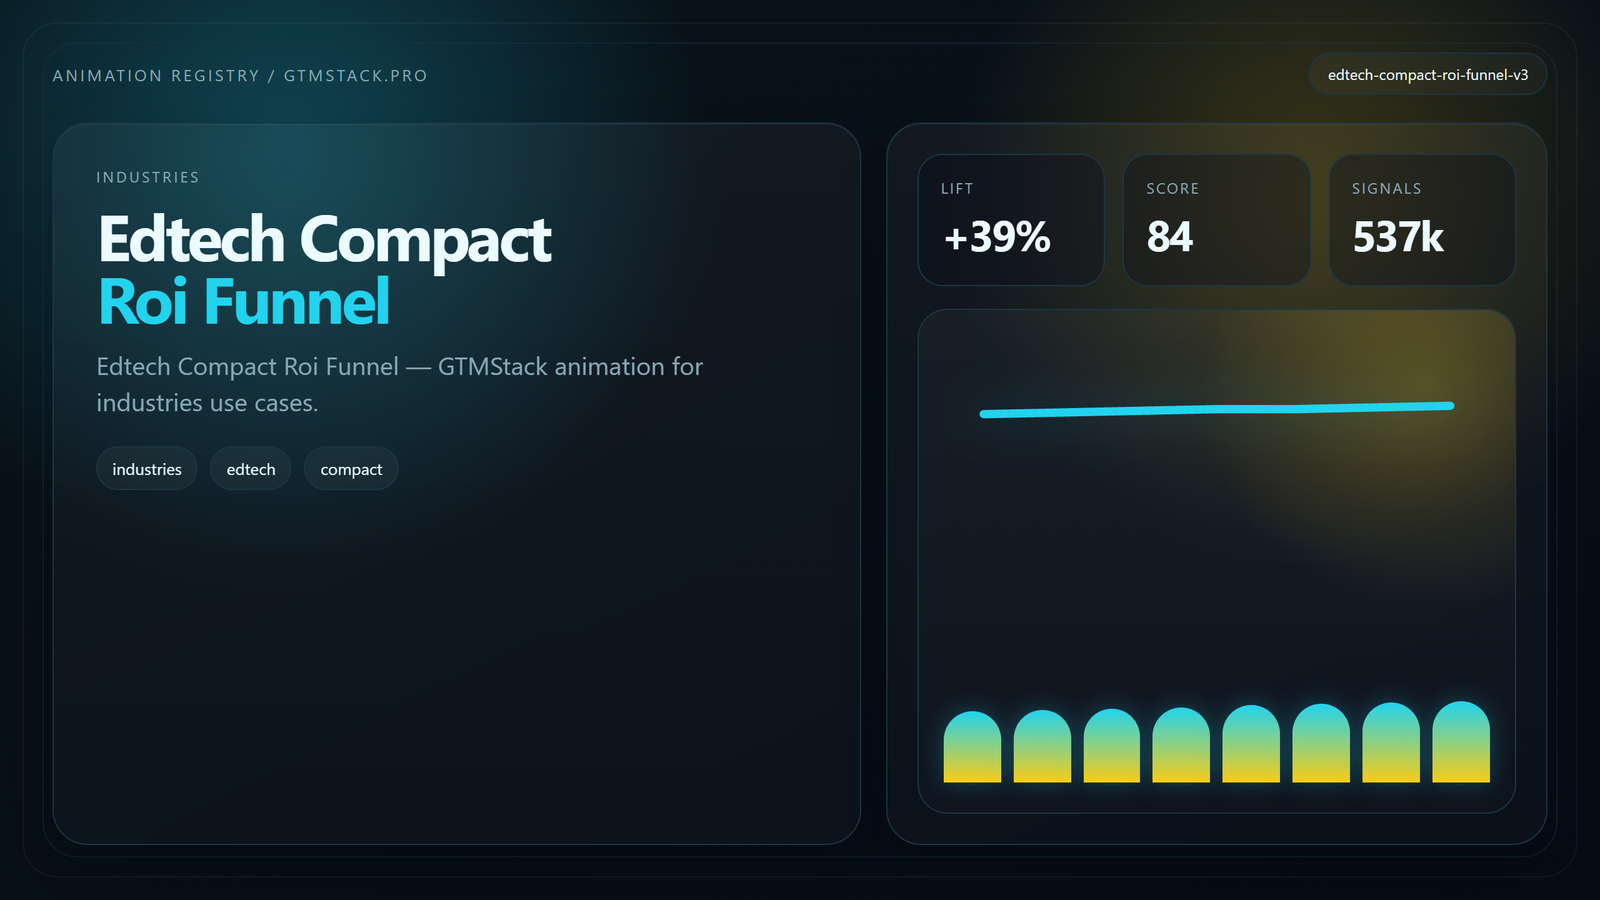
EdTech Compact ROI Funnel
Updated compact EdTech ROI funnel focused on stage conversion, campaign efficiency, and enrollment growth visibility.
Preview →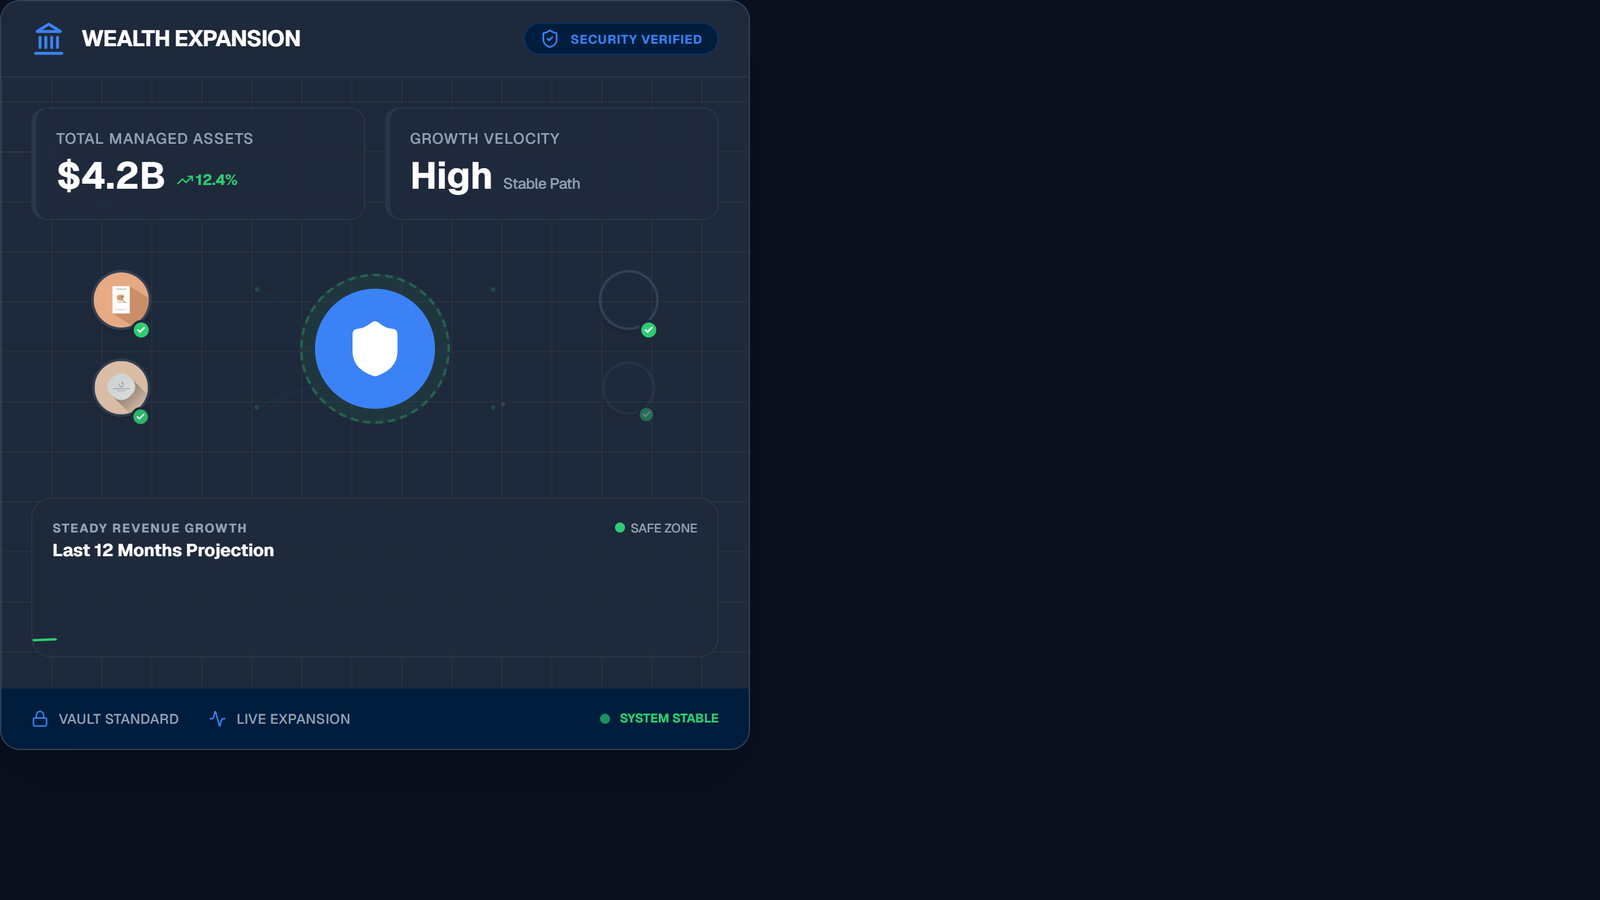
Dynamic Wealth Dashboard Tile
Financial dashboard tile highlighting portfolio stability, growth trajectory, and risk-adjusted performance metrics.
Preview →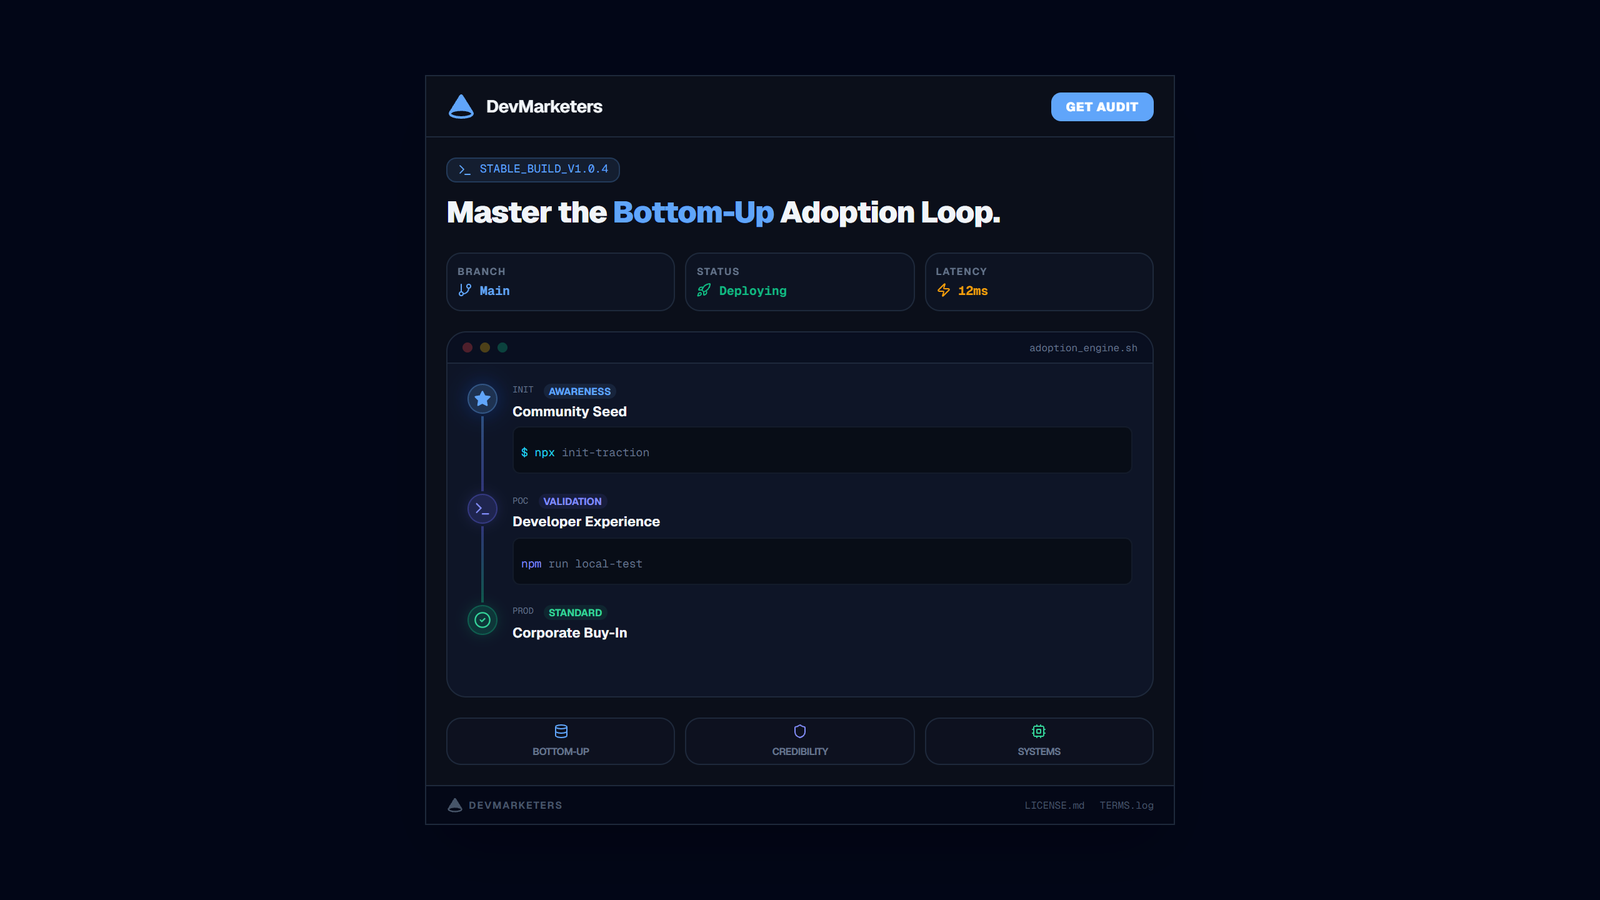
DevMarketers Bottom-Up Adoption Loop
Bottom-up adoption dashboard visualizing product-led growth loops, user expansion, and activation momentum.
Preview →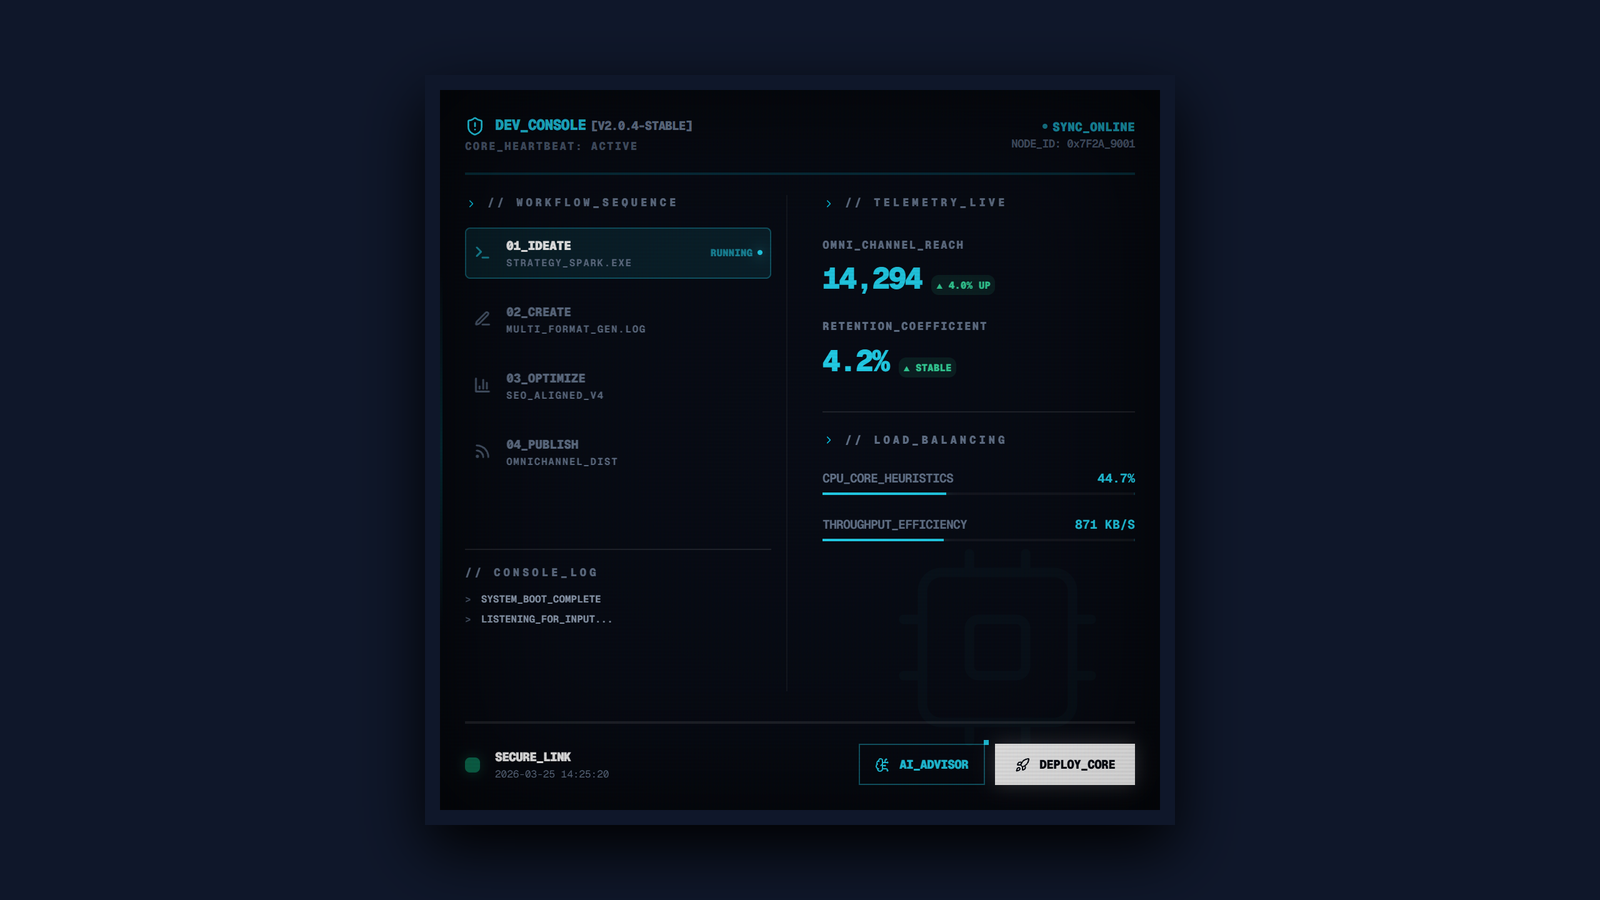
DevConsole Content Workflow
Developer-style content workflow console tracking production stages, telemetry health, and optimization guidance.
Preview →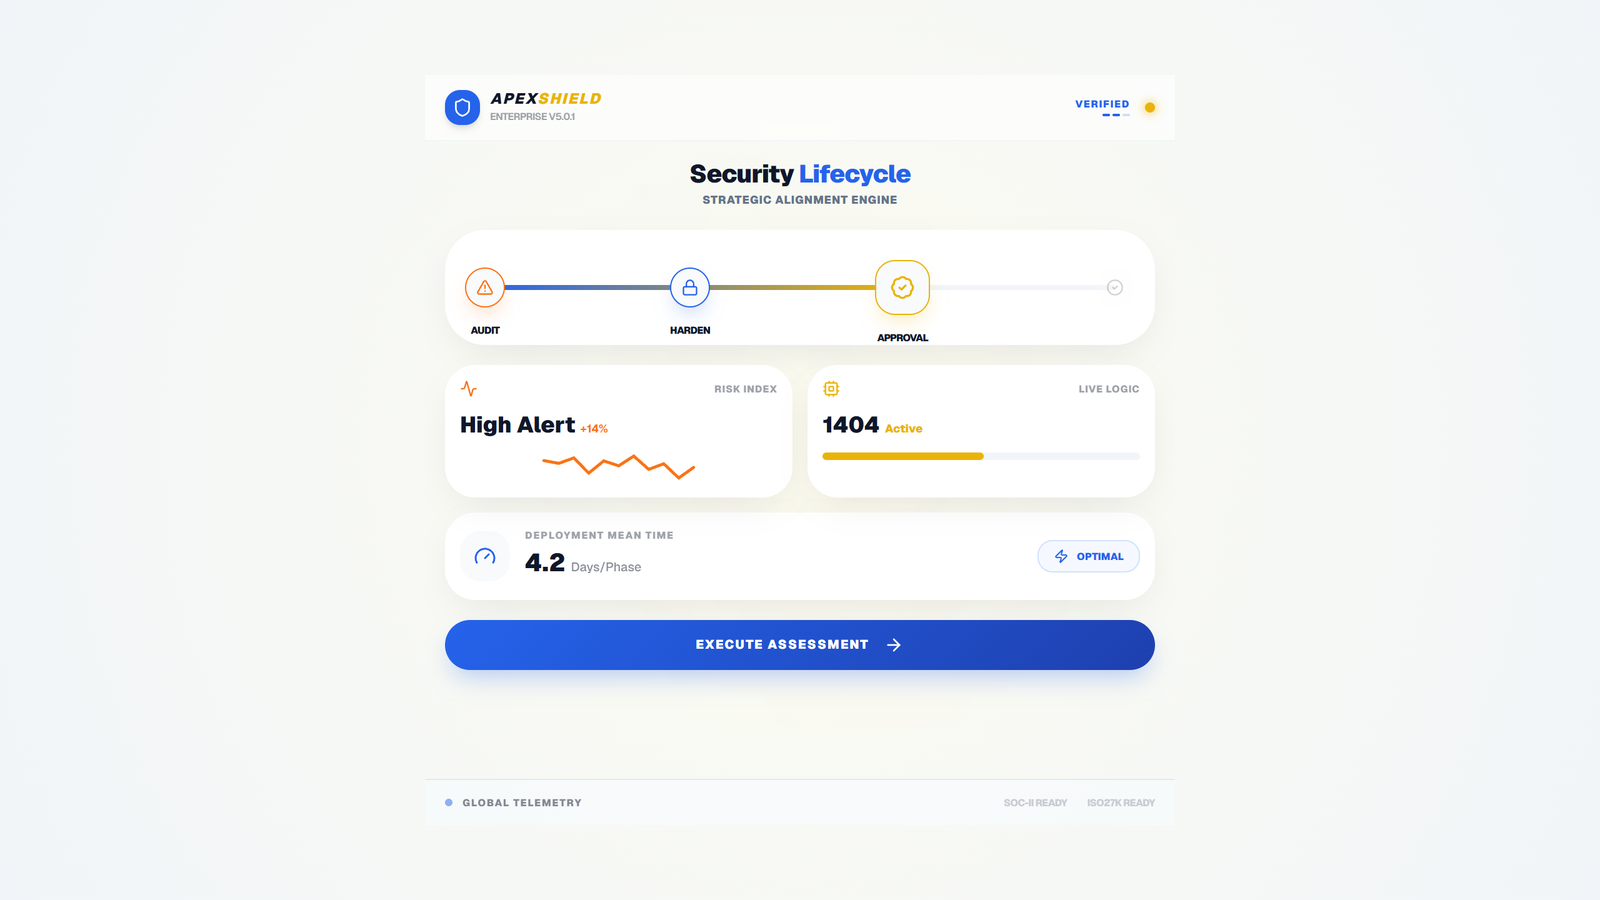
CyberAgency Lifecycle Engine
Security lifecycle engine dashboard showing audit progress, remediation flow, and deployment readiness signals.
Preview →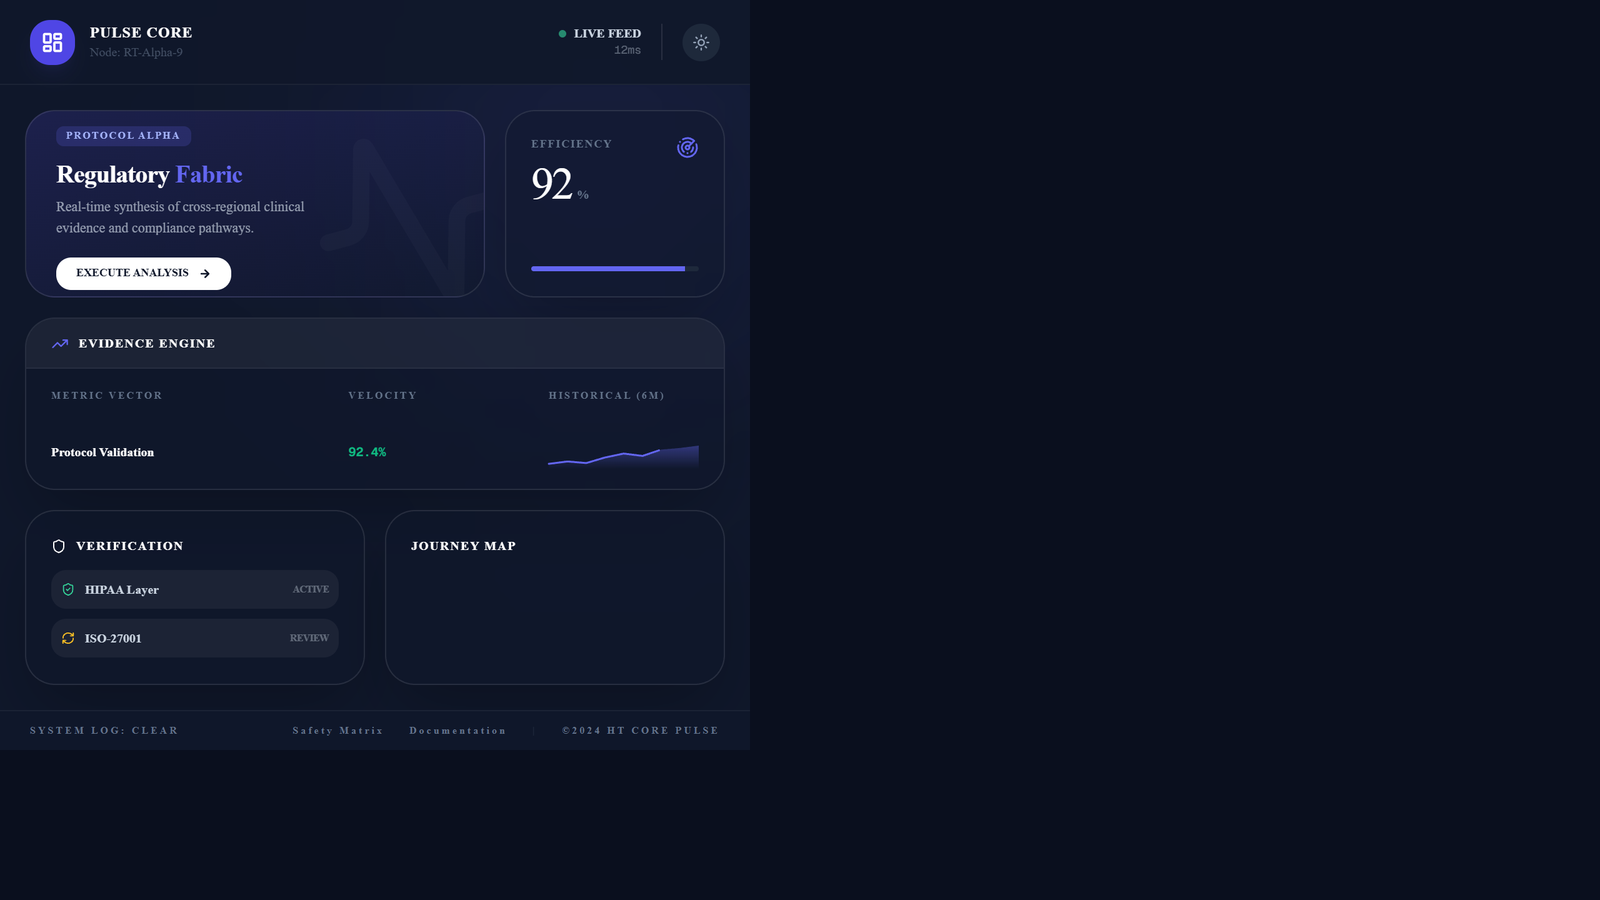
Clinical Validation Surface Dashboard
Clinical validation dashboard tile focused on protocol status, compliance progression, and quality assurance signals.
Preview →Show: